

Hey friends, how are you doing? In this tutorial we are gonna dice into data visualization using python
What is Data Visualization?
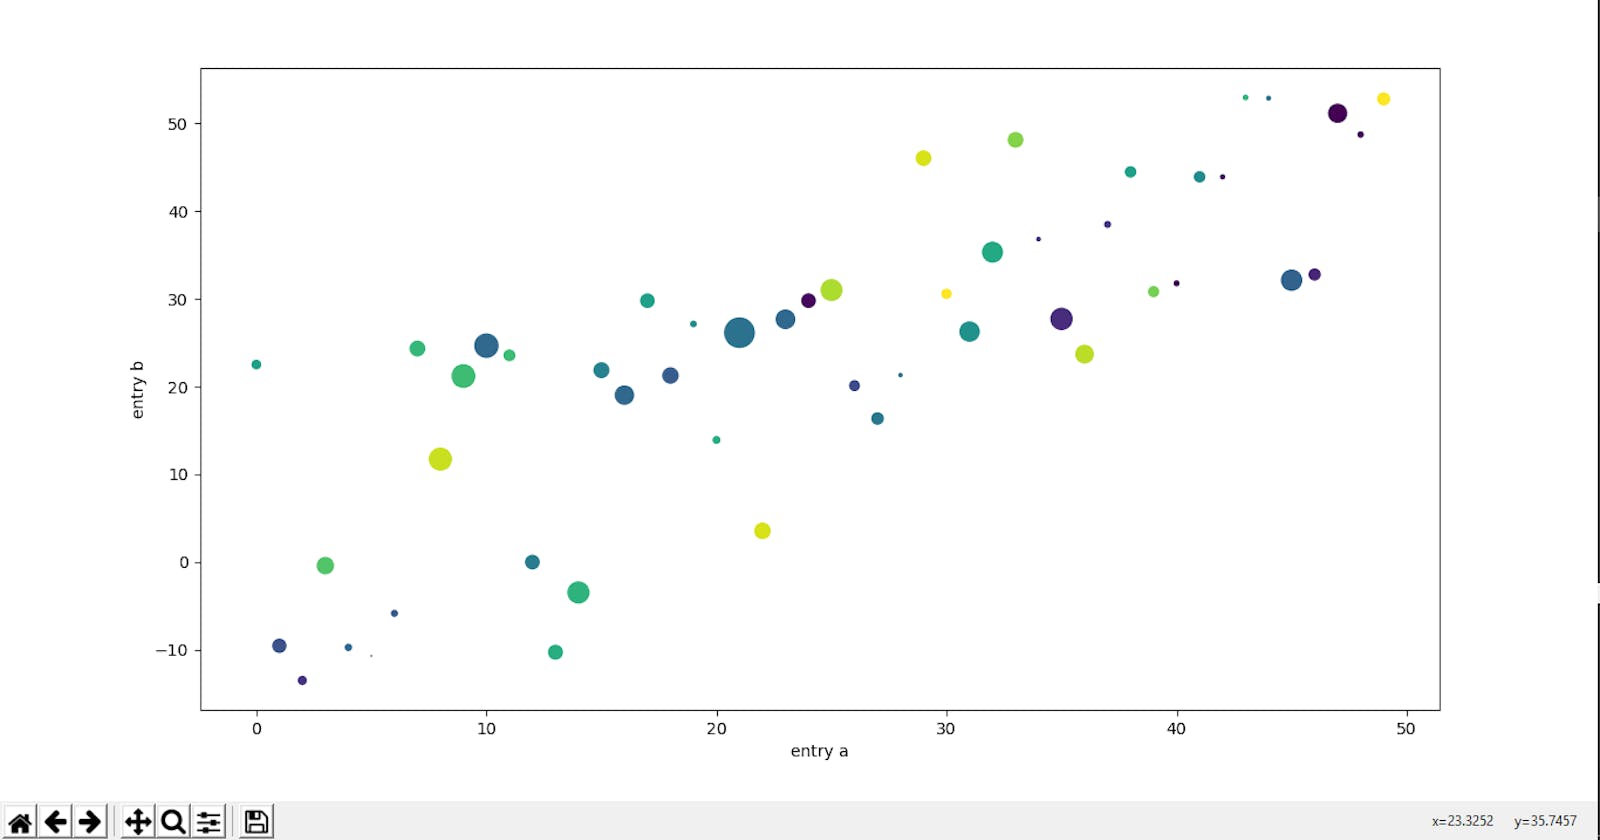
Data visualization is the graphic representation of data. It involves producing images that communicate relationships among the represented data to viewers of the images. This communication is achieved through the use of a systematic mapping between graphic marks and data values in the creation of the visualization.. As seen below
Right now, you will be thinking that's a lot to gasp in, don't worry that's just English , wait till we get to the coding part
Data visualization refers to the techniques used to communicate data or information by encoding it as visual objects (e.g., points, lines or bars) contained in graphics. The goal is to communicate information clearly and efficiently to users. It is one of the steps in data analysis or data science.
Now as you can see data visualization is kinda related to data science and analysis, why? We work with DATA in those field
Examples of diagrams used for data visualization
- Bar Chart
- Histogram
- Scatter Plot
- Scatter Plot(3d)
- Network
- Steamgraph
- Treemap and so on
How those python fill into this?
Python provides amazing libraries for data visualization Examples are
- Matplotlib
- Seaborn
In this post we will be looking at the matplotlib
To work with matplotlib you need to install it first.
Open up your terminal and type
pip install matplotlib
After this, you should have matplotlib installed, next open up your text editor and type in
import matplotlib.pyplot as plt
plt.plot([1, 2, 3, 4])
plt.ylabel('some numbers')
plt.xlabel('numbers')
plt.show()
you should be having this
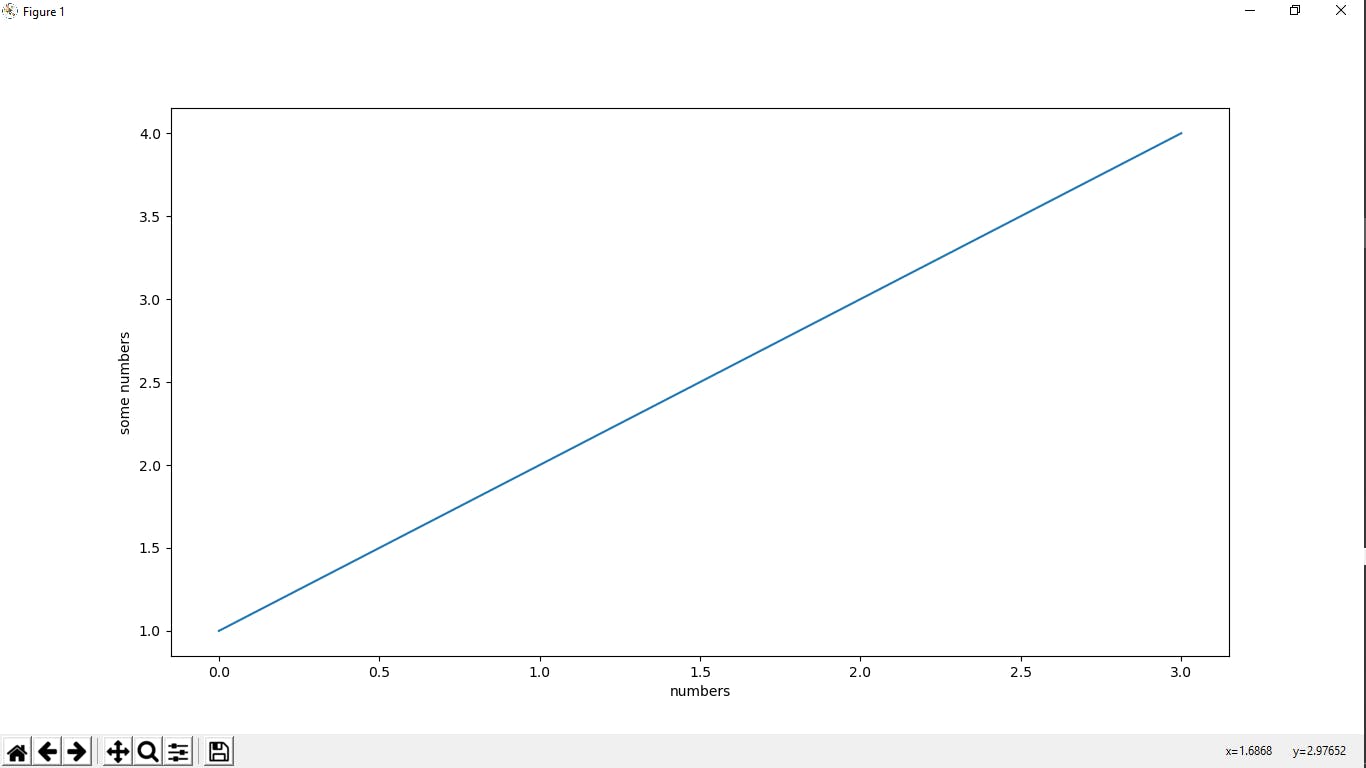
so we imported the module then made a plot with list 1,2,3,4 and we gave our x and y name as you can see in the image just like we have in graphs then finally we show the plot
So this is a basic intro to data visualization in python, you can explore more by learning how to visualize data of a stock price(chart) and learning to use other modules like numpy, pandas and seaborn
Hope you like it.. Leave a comment if any question found Thanks